
Detailed Customizable Reporting
FoodBank Manager has several premade reports that will give you any of the data you need for your Grants, Programs and your Food Bank Partners, but sometimes you need to know more. Especially if you use Food Bank Manager to do more than just record stats. Many Organizations want to see how the people are doing. Use the visit lists to reach out to the Guests in an impactful way. Offer them more than just food for that week. To do this you need reporting that will filter out a particular set of people from the thousands in your database.
What I am saying is you may offer programs to single moms or single dads. Maybe a senior citizen care group that contacts and offers to help the seniors that attend you pantry. Maybe your a church and the Pastor uses the list to call and offer prayer to everyone that attends. Maybe you just want statistics like how many are unemployed. How many are lactose intolerant. The percentage of those that come every week to your pantry that are diabetic or someone in their family is diabetic.
This is just one of the things that FoodBank Manager offers that really sets us apart from the rest of the services out there. The ad hock reporting for the guests, guest visits and the volunteers and staff give you an incredible amount of freedom to determine statistics on any data that you collect. An example of this is a report issued by a Food Bank regarding what they found when they rolled out FoodBank Manager to their partner pantries. Click to view the Sample Report. No other program offers this level of reporting.
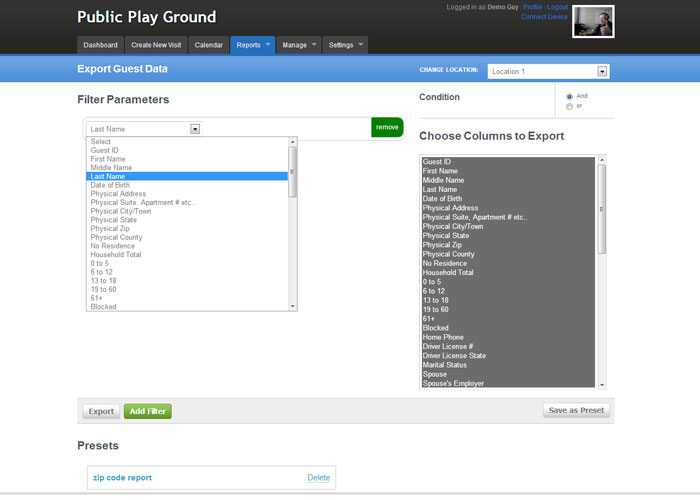
The image below is a snapshot of the Guest ad hock reporting tool. The left panel of this tool is your filter section. The filter section is where you identify individuals that meet the filters set up for the report. For example you set the filter to show "gender" and you select male for the operand. This will give you all males in your database and omit the females. Now add a second filter and set this one to "marital status" and choose single for the operand. Add a third filter and set it to filter for children in the age group 0-18, set the operand to filter for any result greater than zero for that age group. What you end up with is every single dad with at least one child between the ages of 0-18.
The list to the right is the output list. So maybe you want every column of data available in the report for those single dads. Then again maybe all you need is their name and address for a mailer you will be sending out to them. To define your output all you need to do is select the fields you want reported to your spreadsheet. There is also a condition flag that lets you choose the behavior of the filters to be "and" which makes it so any output met all of the filter conditions and "or" which means the output has to meet any one of the filters but not all of them.
Once you set up reports you can also save them so you don't have to rebuild a report you run every month, we call them presets. Just click and go.
back to top