
Outreach Aggregate Report
The Outreach Aggregate report provides you with a complex look at your pantries activities with a push of a button, saving you time and the frustration of creating complex reporting through Excel.
Here are the highlites of this report:
- More advanced than the Duplicated/Unduplicated report.
- Provides you with four (4) important views of your data: New, Returning, Total (duplicated) and Unique (unduplicated).
- New and Returning reporting is based on four (4) selectable options: Calendar Year, Fiscal Year, This Month and Ever.
- Choose to view data based on attendance or by programs received.
- Sum or Count the data points you collect.
- Pivot on the data collected to divide the results by those data points.
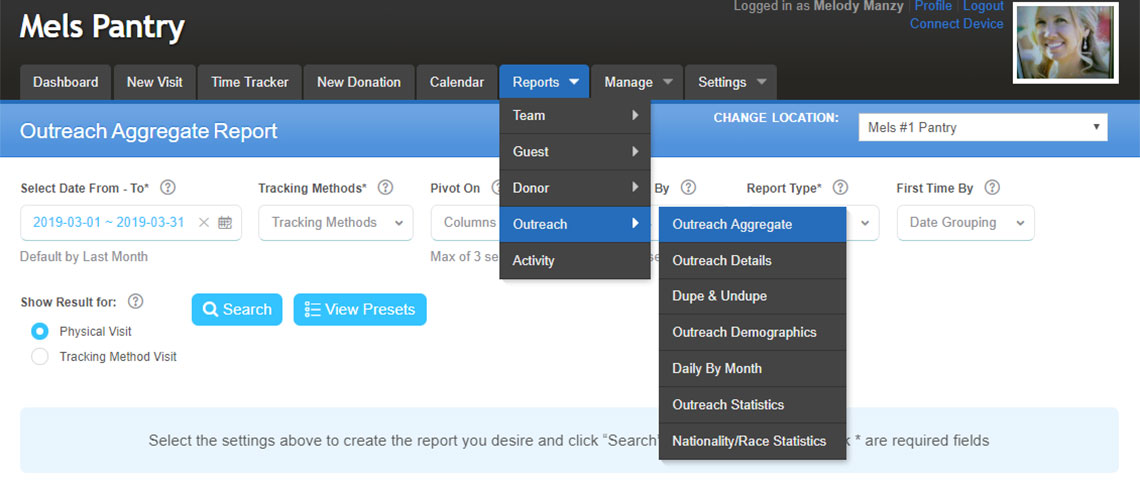
Selecting the Report:
To select this report, go to Reports > Outreach > Outreach Aggregate.
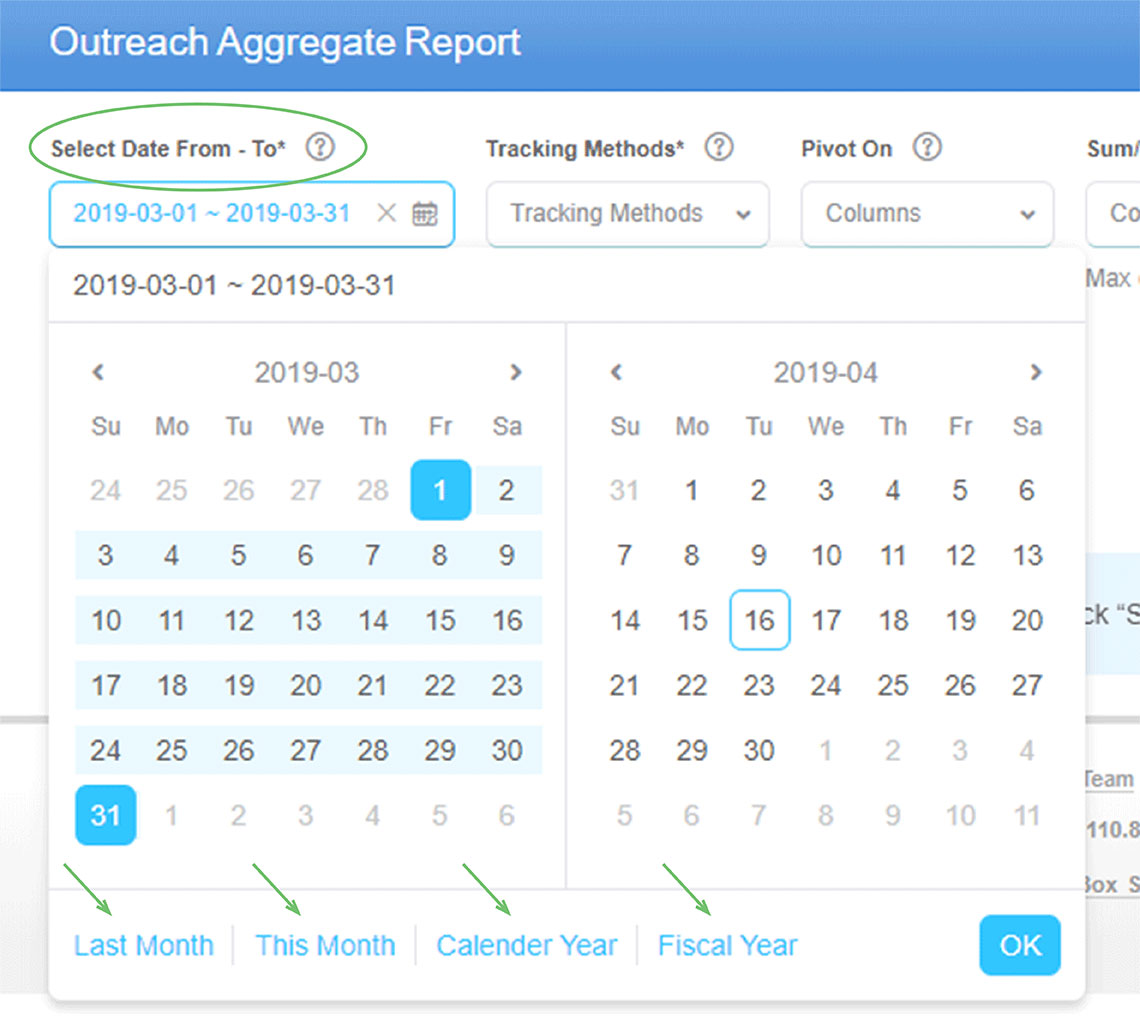
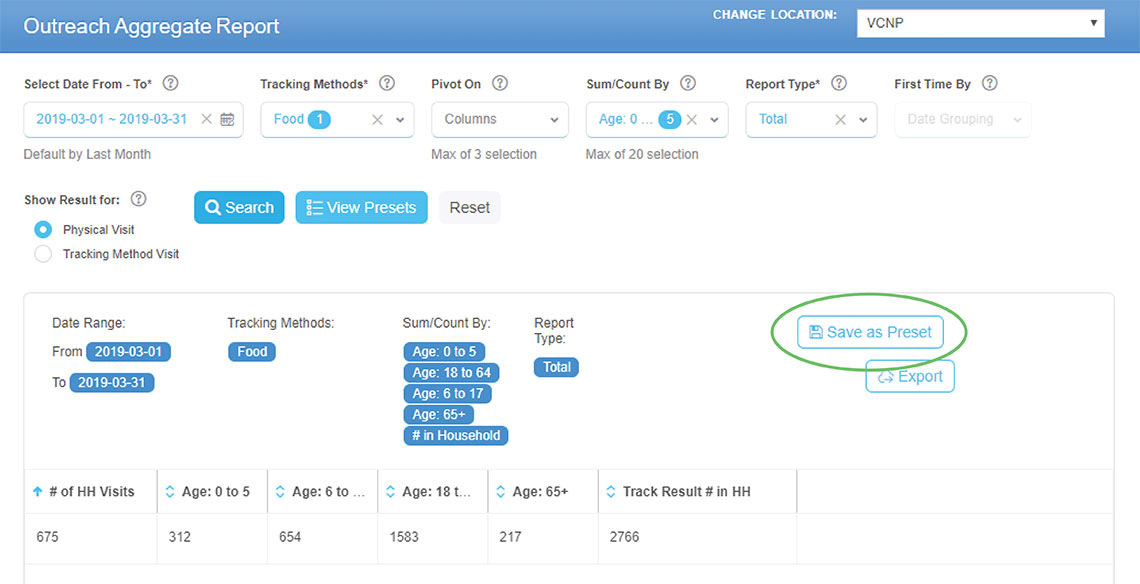
Setting the Report Range:
Start by choosing the From - To dates you would like to work with. Once you click on the date range box, you can select your dates by using the calendars, or by choosing one the fast select options at the bottom of the field (identified by the green arrows). To work with a single day, just double click on the day. All entries will be locked in when you click OK.
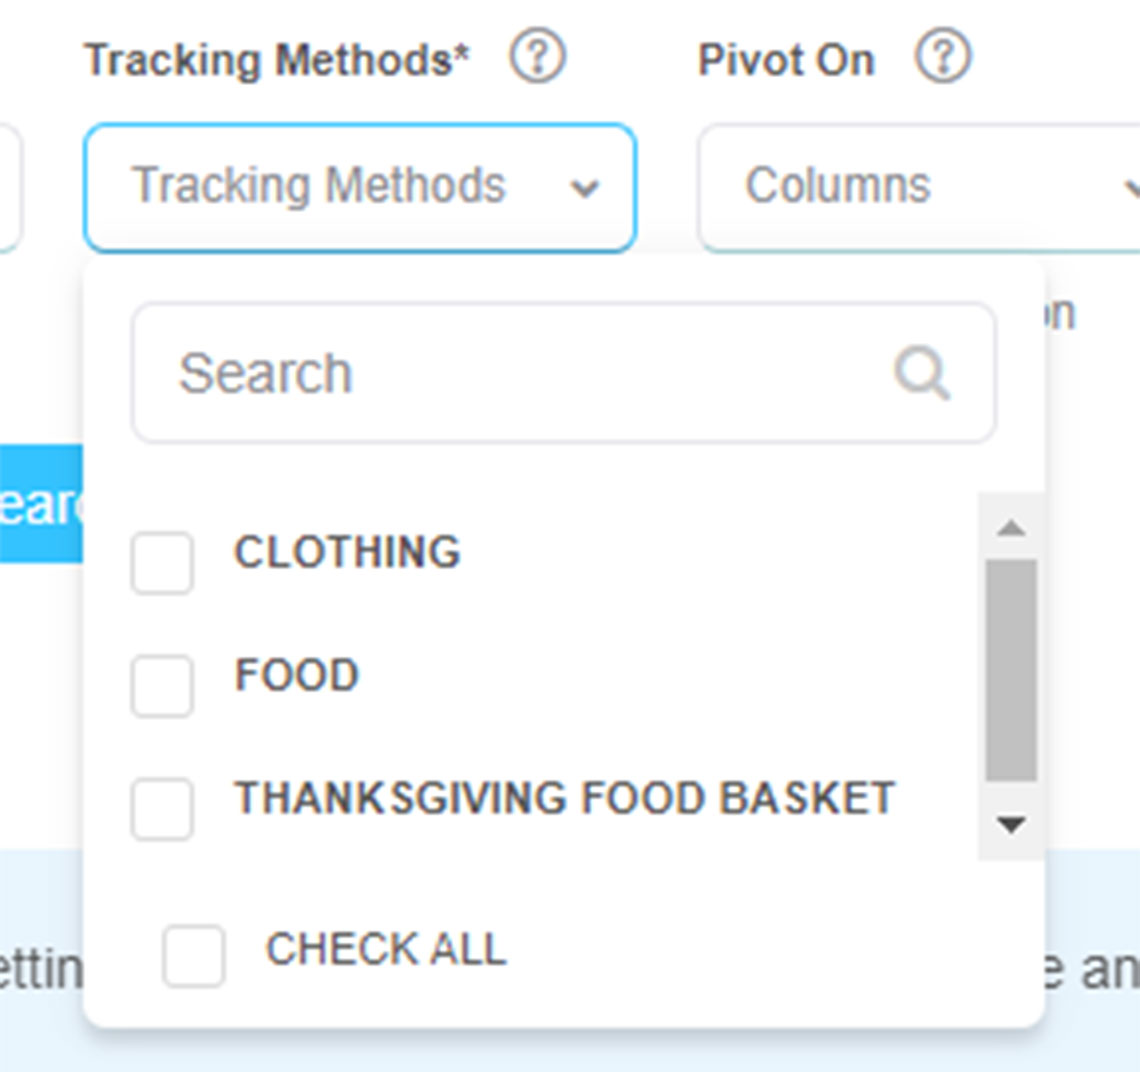
Choose the Tracking Method/s to Report On:
You can select several tracking methods at the same time or just choose one. To make it easy to select all of the tracking methods in the report, there is a ‘Check All’ box located at the bottom of the list.
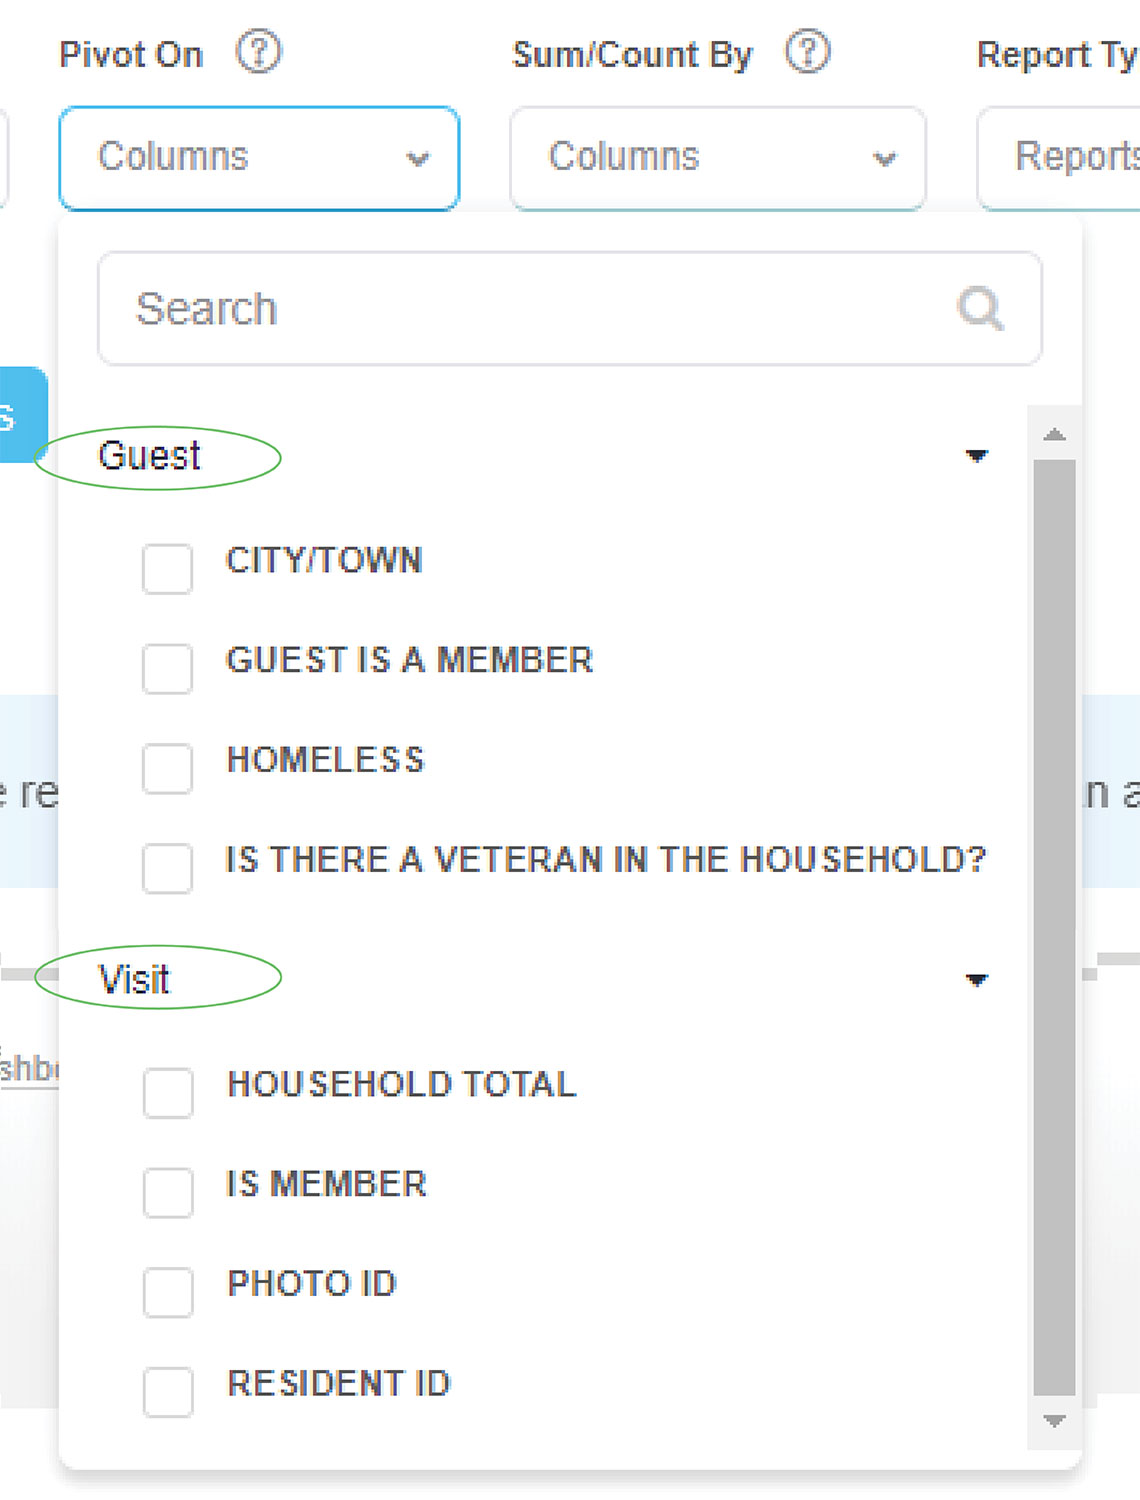
Using Pivot On:
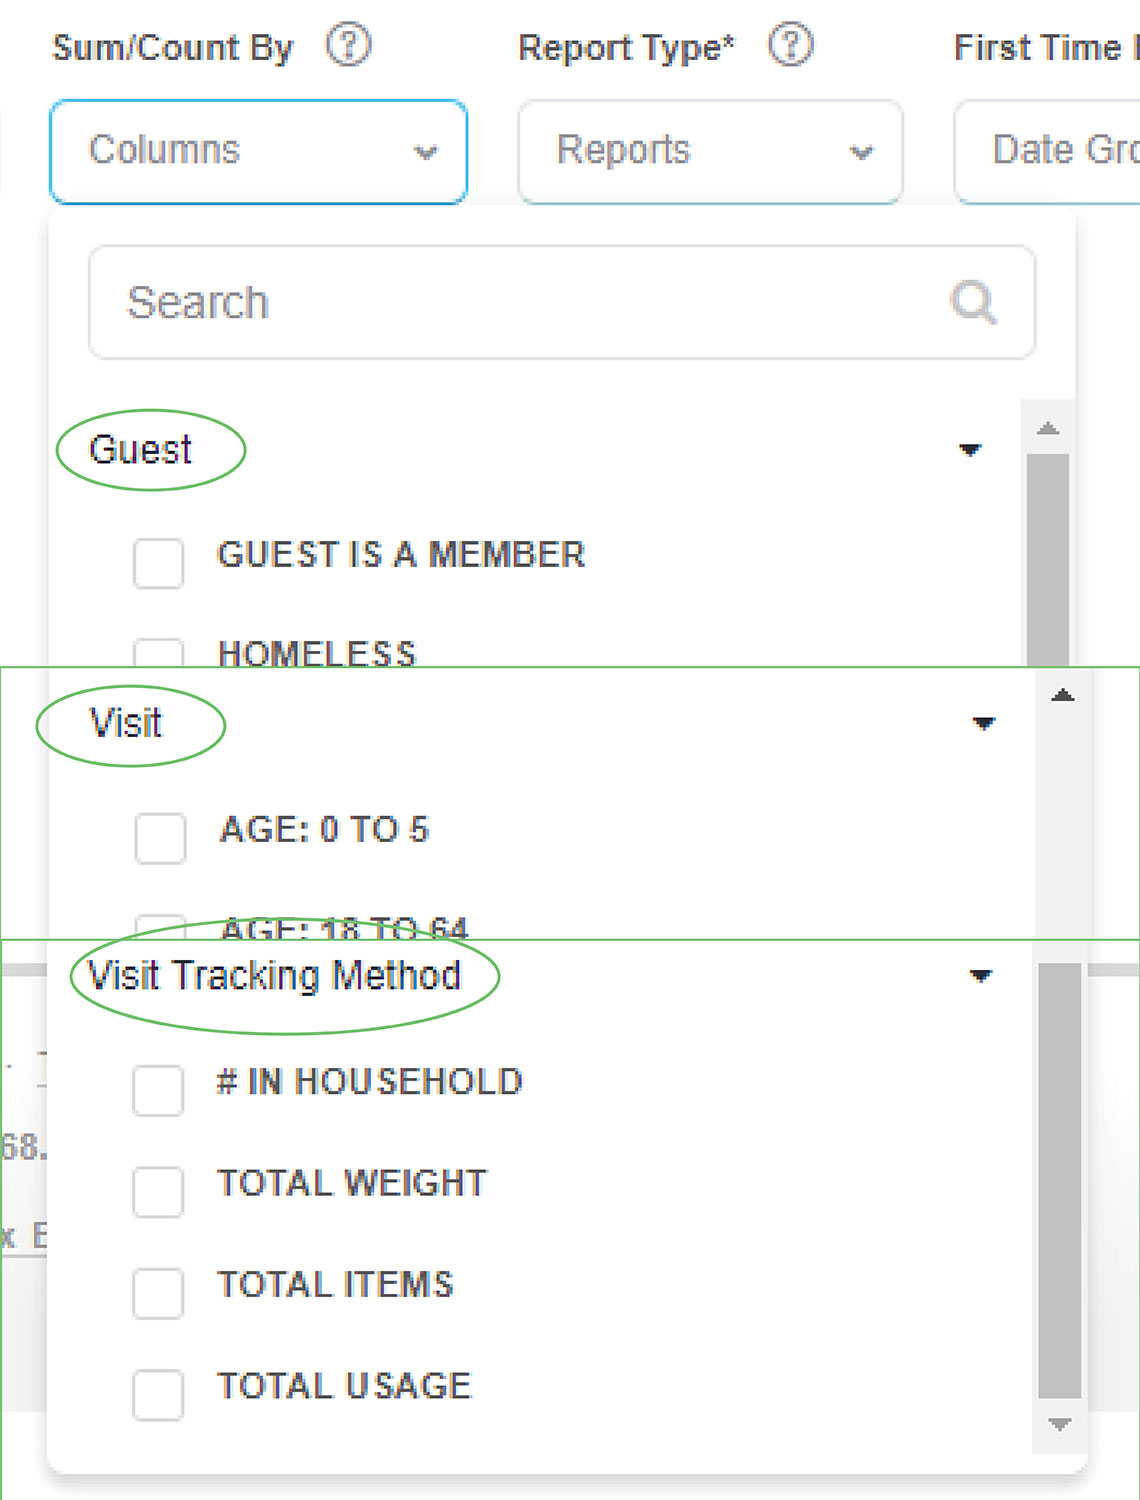
Pivot On columns allow you to add a field/s to divide the report results. An example of this would be a Yes/No field. The results presented will show both Yes and No data sets. You may choose from Guest record fields and/or Visit fields. The Pivot On field is not required, however the maximum number of fields you can pivot on at any one time is three (3).
Using Sum/Count By:
The Sum/Count By columns display the results on the same row, as that data is part of the larger request.
This selector works differently depending on the type of field chosen. The data from this section will be represented within the data set (row), which is very different than how ‘Pivot On’ divides the results into seperate rows. This field is not required, and you may select up to twenty (20) fields at one time.
- Sum will add the field values for any field that collect numbers. An example of this would be weight, household total or age groups.
- Count By will total the number of times each option is present in the data set provided. An example would be how many Yes and how many No results.
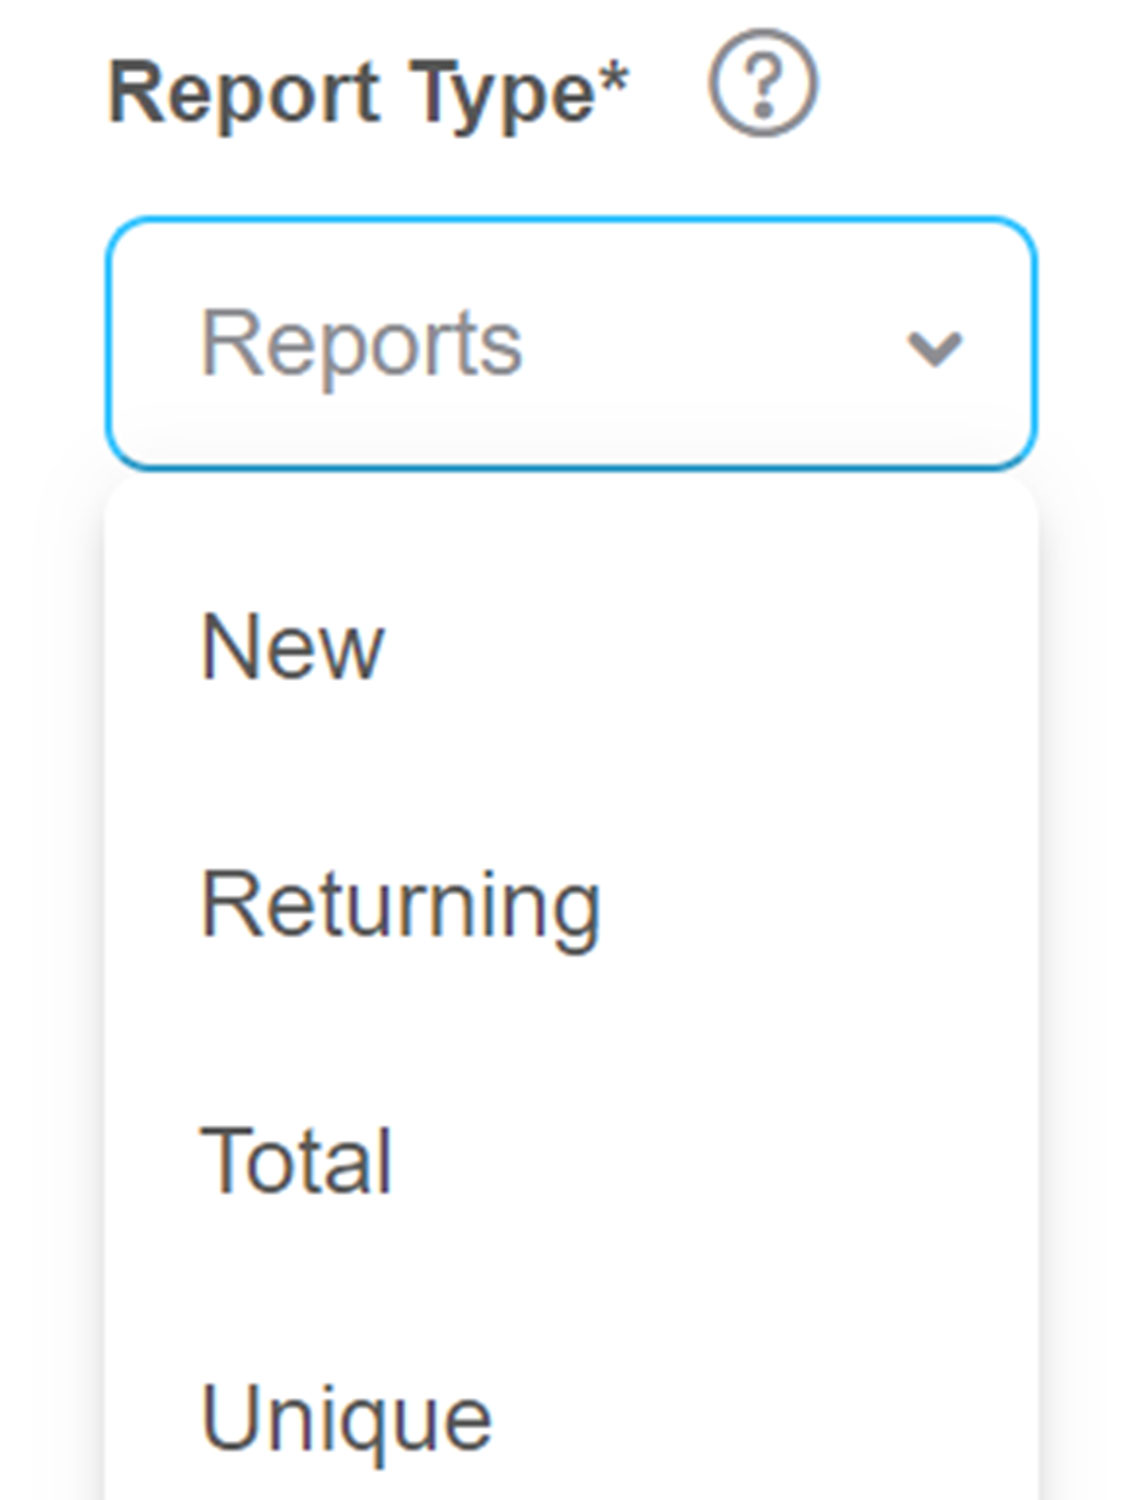
Choosing the Report Type:
Report Type allows you to choose the type of report. There are four report type options. This field is required, and you may only run one (1) report type at a time.
- New provides a data set that only shows the results for visits that are considered new within the date range set for this report. What determines a new visit is configured in the ‘First Time By’ selector (shown in the next section below). If new is chosen you must choose how new is calculated in ‘First Time By’.
- Returning provides a data set that only shows the results for visits that are considered 'not new'. Another explaination is all visits minus the new visits within the date range selected for this report. What determines a 'not new' visit is configured in the ‘First Time By’ selector. If Returning is chosen you must choose how 'not new' is calculated in ‘First Time By’.
- Total is synonymous with duplicated. Total will provide a data set result that adds all visits in the selected date range for the report. When Total is chosen the ‘First Time By’ selector is not needed and will be greyed out.
- Unique is synonymous with unduplicated. Unique will provide
a data set result that only reports on the first visit for each client in the selected time
period. When Unique is
chosen the ‘First Time By’ selector is not needed and will be greyed out.
Caution: Do not confuse Unique with First Time!
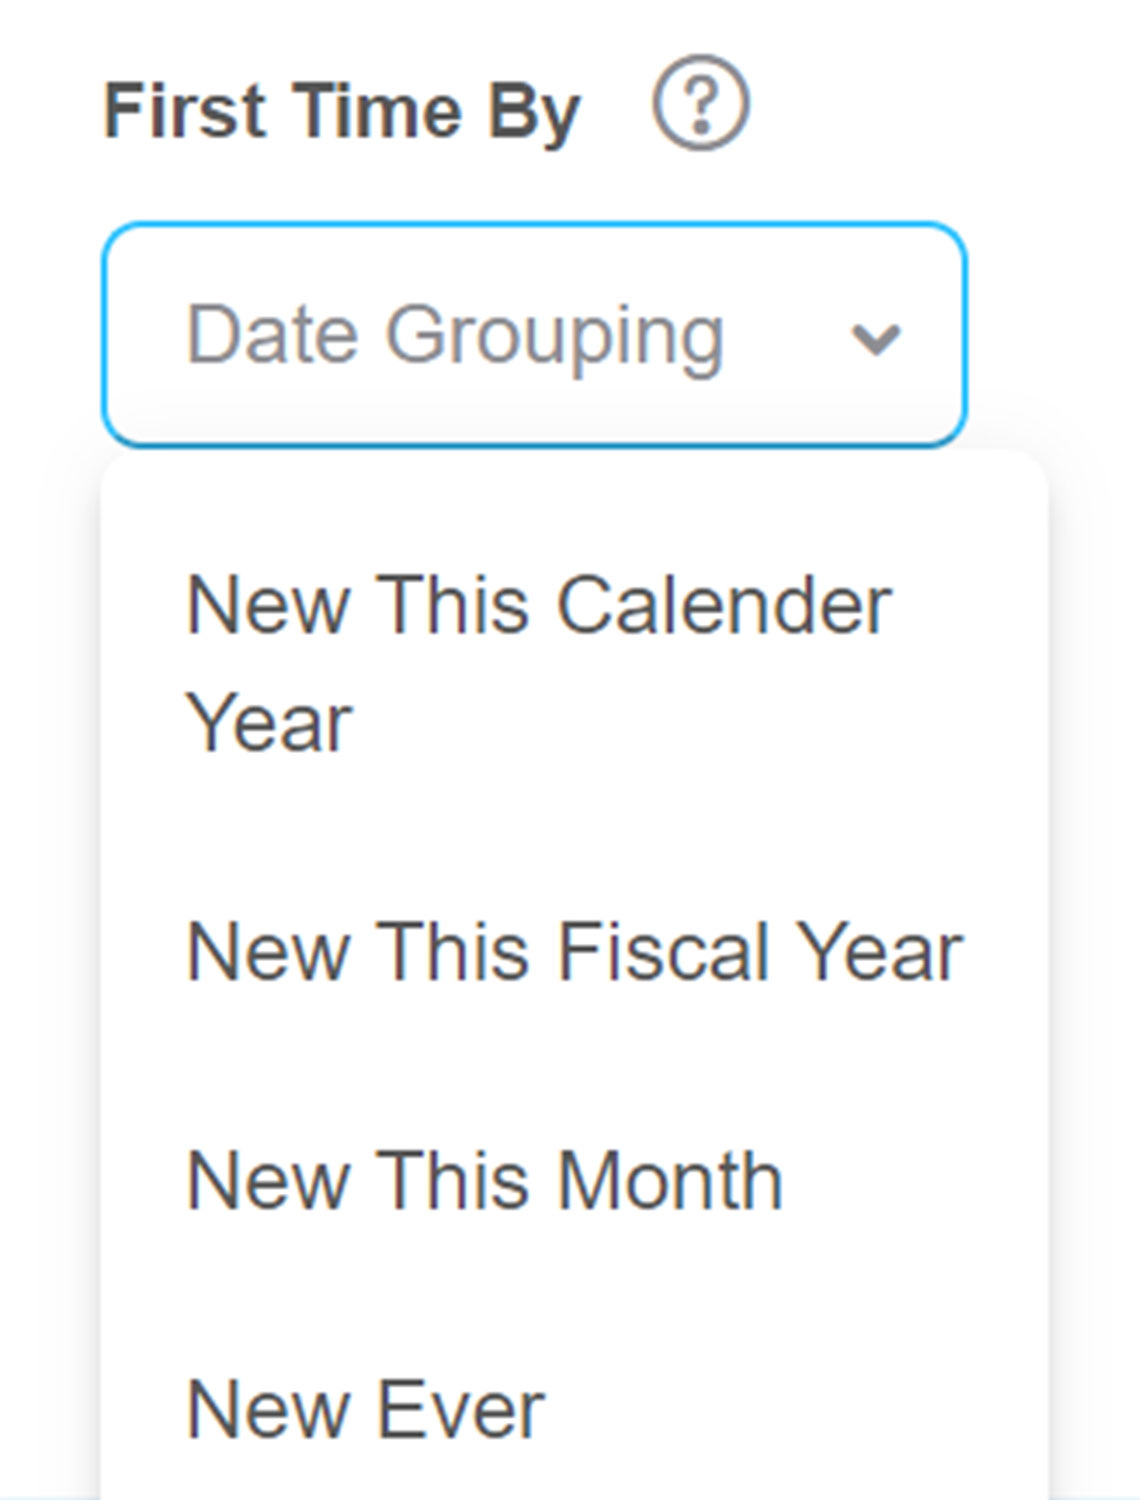
Setting First Time By:
First Time By is the partner to the ‘Report Type’ selector. It is used to test the selected visits to determine if a visit is new or not new. This works by comparing the visits within the date range chosen and determines if the visits for each household are new visits or returning visits. This field is only selectable when ‘Report Types’ New or Returning are selected. There are four (4) options for determining ‘New’ or ‘Returning‘ (not new).
- New this Calendar Year: Tests the selected visits against all of the visits made this calendar year.
- New This Fiscal Year: Tests the selected visits against all of the visits made during the fiscal year set in settings > settings > general.
- New This Period: Tests the selected visits against the visits within the selected date range.
- New Ever: Tests the selected visits against all visits ever recorded.
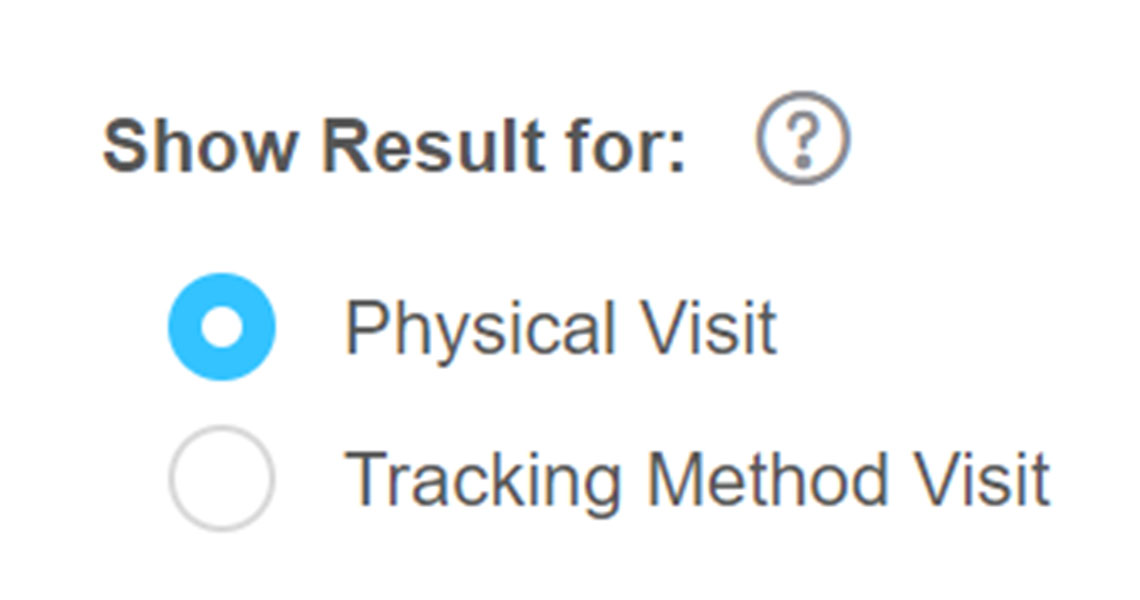
Tell the Report what a Visit is:
Show Result For is how you tell the report what a visit is. There are two options: Physical Visit (attendance - commonly used) and Tracking Method Visit (rarely used). This field defaults to Physical Visit (attendance), be sure to set accordingly for each report you run.
- Physical Visit (attendance) considers all services received during a visit as one (1) visit. An example is John comes in and receives food and clothing. The physical visit will count both services as only one (1) visit and outputs results for one (1) visit.
- Tracking Method Visit considers each tracking method received during a visit as separate visits
. An example is John comes in and receives food and
clothing. The program visit will count both Tracking Methods (programs) as their own
visit and outputs results for two (2) visits.
Caution: Expect duplication of visit numbers when choosing Tracking Method Visit.
Saving a Report for Later Use:
Step One: Click the 'Save as Preset' Button
Save as Preset allows you to save the report configuration. Once you have configured the report click on ‘Search’ to generate your results. You will see that the ‘Save as Preset’ button is now visible. When you click on it, you will have the option to update a preexisting preset or to save a new one. Fill in accordingly and save. A pop-up box will notify you that the report has been successfully saved.
Step Two: Choose an existing report or add a new one
Updating an Existing Report: If updating an existing report choose the report to update in the top box.
New Report: If saving as a new report enter in the report name in the lower box.
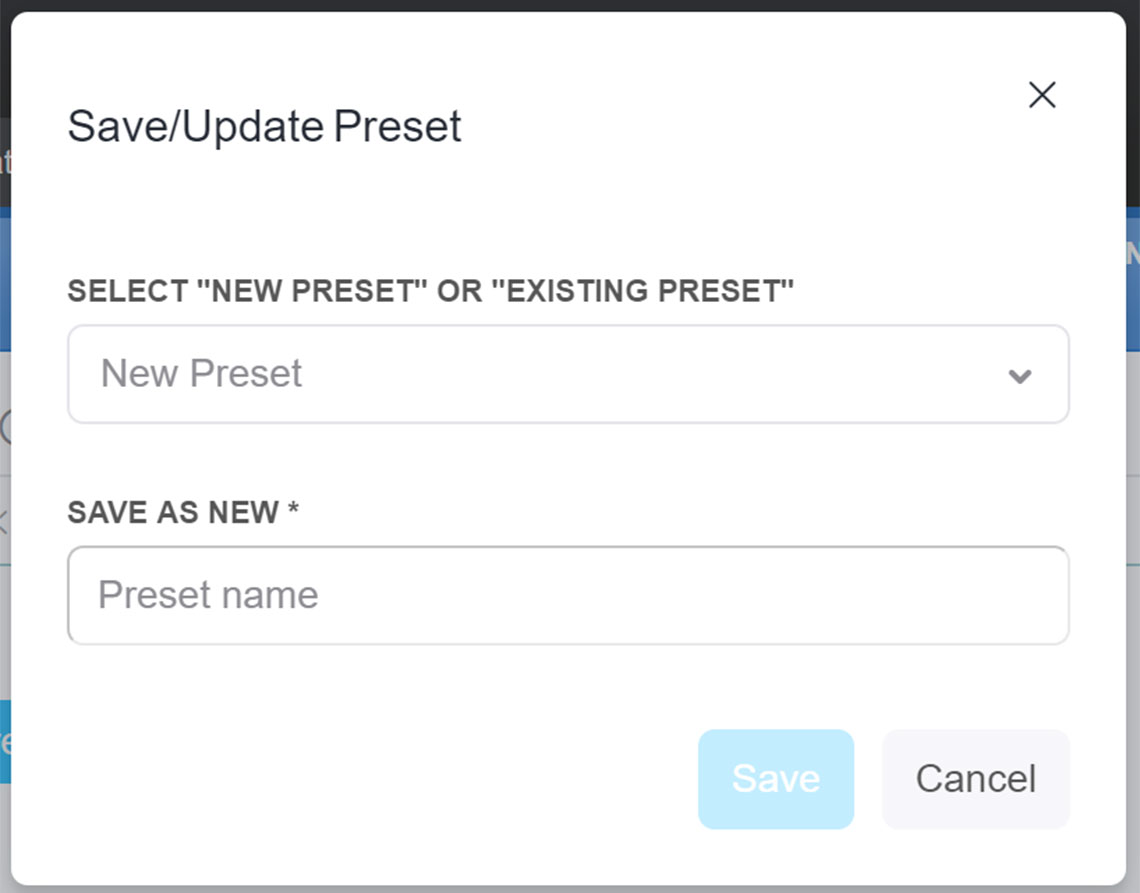
Step Three: Saving the Report
Click the "Save" button and you will see the success notification.

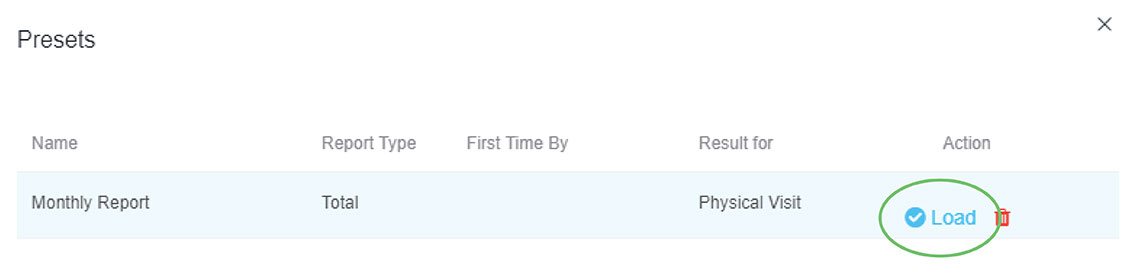
Recalling a Saved Report:
To recall an existing saved report click ‘View Presets’. Find the saved report you want to run and click ‘Load’. The date range will always default to Last Month, so you will need to put in a new date range each time you use the report.

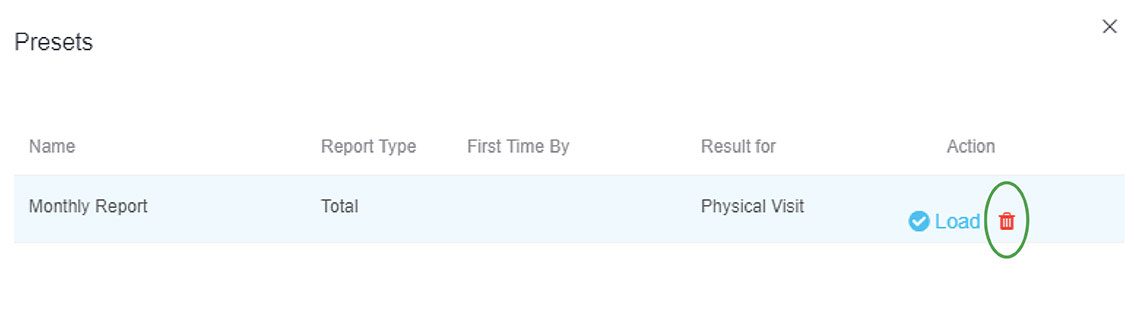
Removing a Saved Report:
Step One: Locate the Report you wish to Delete
To delete a preset report, just click on the trash can icon next to the report you wish to remove.
Step Two: Are you sure?
A prompt will pop-up to verify the deletion, click ‘Yes’ if you are sure you want it deleted.
Step Three: Success!
A final pop-up will let you know you have successfully deleted the preset.

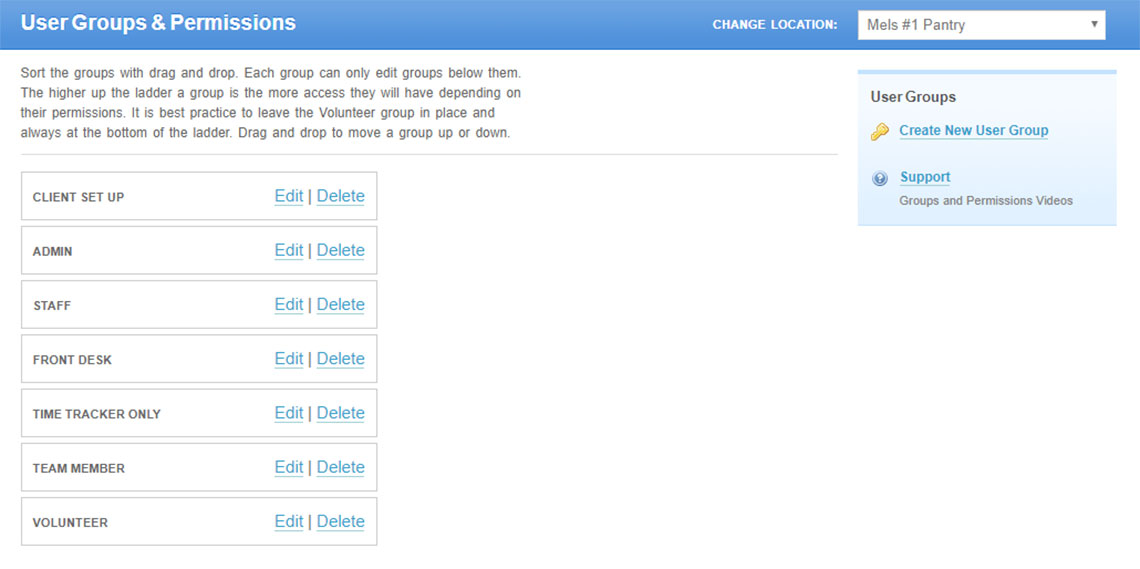
Allowing Others to Use this Report:
This report is defaulted to show for Super Admins only. To turn this report on for other Groups, go to Settings > Groups & Permissions. Edit the Group and find the permission called ‘Outreach Aggregate’. Change the setting from ‘None’ to ‘View’ and then click ‘Submit’.

Have Questions? Call us +844-896-9577 toll free, or use the CONTACT button to send us a question.
We want to be your partner in the effort to help those in need.