
DUPLICATED and UNDUPLICATED (DUPE and UNDUPE) REPORT
This report is the cornerstone of all data regarding your service numbers, and provides you with the following information within the date range that you select:
- Number of distributions you have provided.
- Number of unduplicated and duplicated households you have served.
- Total number of unduplicated and duplicated individuals you have served.
- Break down by age group the unduplicated and duplicated individuals you have served.
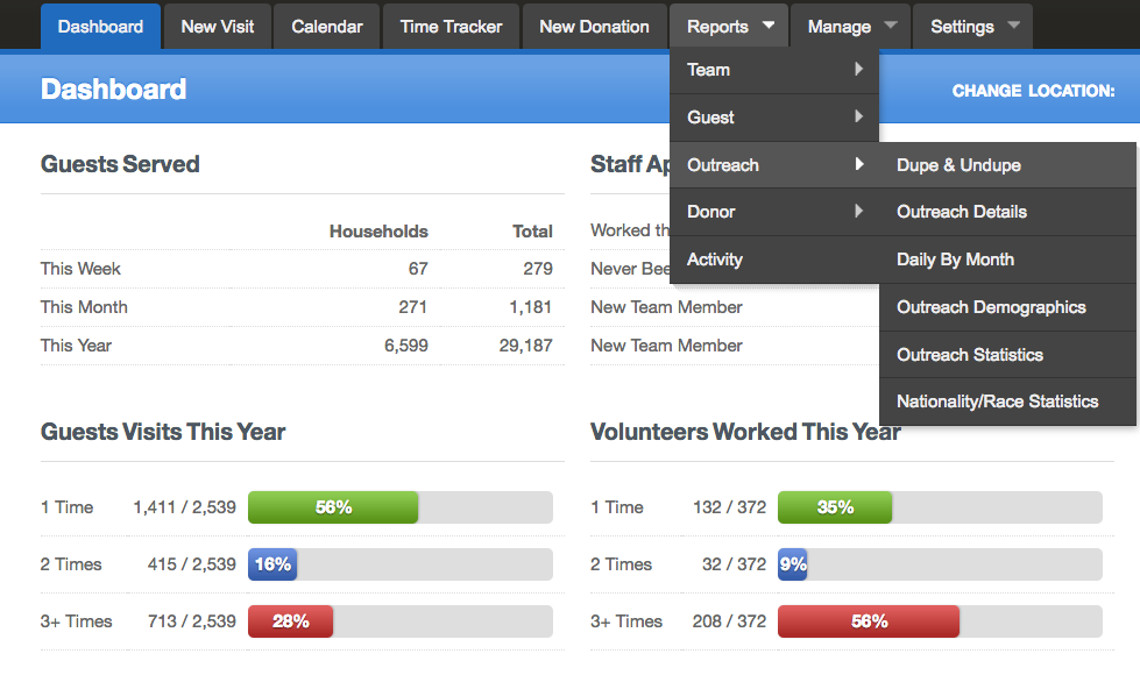
To open this report select the "Reports" tab at the top of the dashboard screen. Drag your curser down to the "Outreach" menu item. This will open a submenu showing the different outreach reports available. Drag your curser to the submenu item “Dupe & Undupe” - click it.
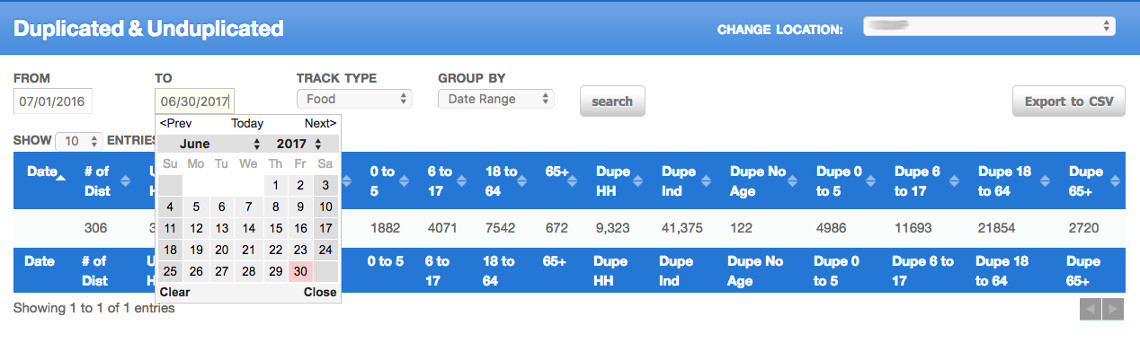
To configure the report, enter the date ranges that the selection of data will contain. To do this click in the "From" date box and using the date picker choose the starting date for this report. Follow the same procedure to set the "To" date or the last date you want your data selection to contain.
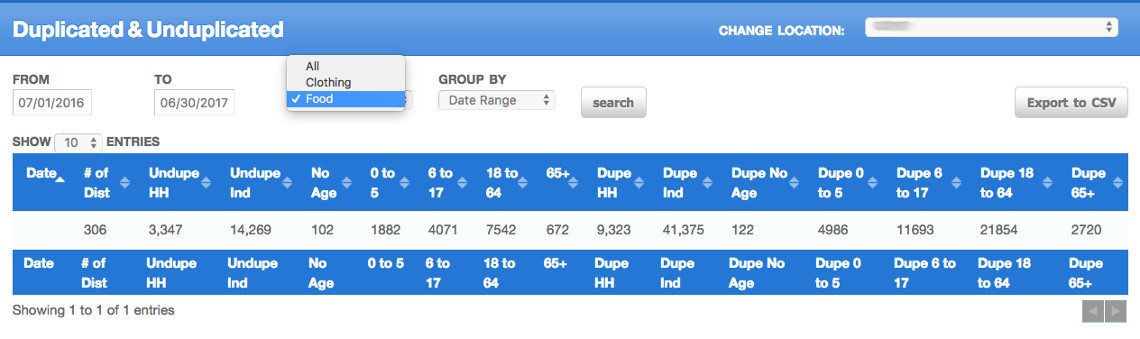
Click on the "Track Type" box to see a list of all of the services that you provide and choose the one you want to report on.
TIP: If you select “ALL” for "Track Type", this may skew your numbers and is not always beneficial. Select each track type individually for complete accuracy.
Select how you want the numbers presented by choosing the appropriate "Group By" option. It is important that you understand how "Group By" will affect your report. Below are guidelines based on the date range chosen and the "Group By" you should consider for best results.
- You choose a month sample in the date range sections. Example 6/1/2017 to 6/30/2017. Consider choosing group by "Month".
- You choose a quarter and want the data as a single data sample, not broken into months. Example 4/1/2017 to 6/30/2017. Consider choosing group by "Date Range".
- You choose a year date range. Example 1/1/2016 to 12/31/2016. Consider choosing "Year" for the group by.
- You choose a fiscal year in your date range. Example 7/1/2016 to 6/30/2017. Consider choosing group by "Date Range".

Now that the report is configured for the data needed click on the "Search" button. This shows the numbers requested on the screen. You can also click on the "Export to CSV" button, found at the top right hand side of the screen. Export the report to have a paper copy or to customize the data to your needs or place in another report format.
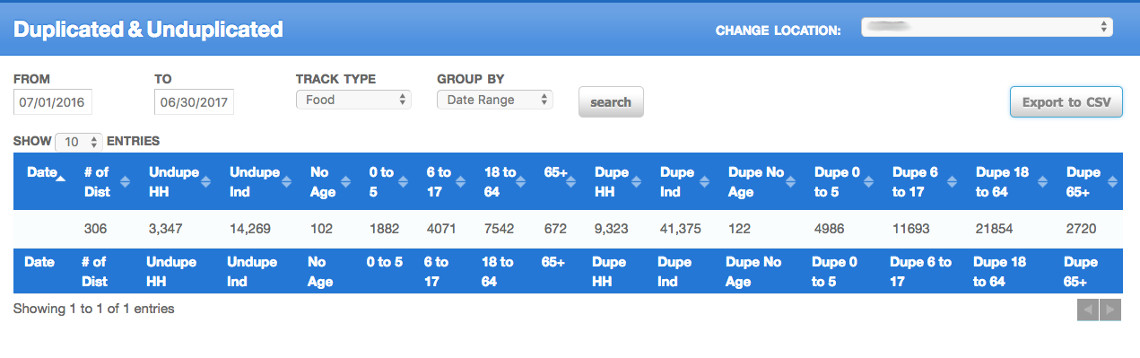
The image above is a report from a real pantry. The date sample is for a fiscal year 7/1/16 to 6/30/17 and is only reporting on the 'Food' track type and grouped by 'Date Range'. This provides the duplicated and unduplicated numbers for the entire fiscal year. If you want to see the actual report click the "Download" button to the right for a copy.
Examples of How to Make Use of this Report:
Quantifying Percentages of Specific Age Groups Served:
I need to know the percentage of children age 17 and younger that have visited the pantry during that fiscal year.
Looking at the report above you can see that we break out the 17 and younger into two age groups. To get the number I need, I will add the two columns (unduplicated) together to get the total for 0-17 and divide that total by the total number of unduplicated individuals:
Using the report above, I have an unduplicated count of children 0-17 adding to 5,953. The unduplicated individuals total is 14,269.
I will then divide the children count by the total individuals count like this: 5,953 ÷ 14,269 which equals 0.417 rounded up to .42 or 42% of the clients the pantry provided food for were children.
You can use the same method for seniors.
Converting Numbers in Your Messaging:
Example Messaging using the data from the report above:
This pantry served 9,323 duplicated households in a one year period. You can craft this information to read “Our agency provided 9,323 food visits to our clients last fiscal year.”
During that same year, this agency served 9,323 duplicated households and 3,347 unique households. “Our agency provided 9,323 visits to 3,347 families last fiscal year.”
You can also say:
With 14,269 unique individuals in the year: “Our agency provided resources 9,323 times to 14,269 people in Fiscal Year 2016/17.”
Switch up the message based on the audience: “Our agency provided nutritious food to 14,269 unique individuals last fiscal year, with 42% being children age 17 or younger.”
If your duplicated individuals number is 41,375 you can say “Through 9,323 visits, 14,269 unique individuals received food and access to community resources 41,375 times.”
Get creative! Make your accurate data work for you and the people you serve!