
OUTREACH DEMOGRAPHICS REPORT
The Outreach Demographics report provides statistical visit data by combining all outreach data, within the date range selected, into a sigle line item. The key component of this report is the ability to break down information by three demographics:
- County
- City
- Zipcode
This report also provides the information below in a line item format based on the demographic chosen:
- Tracking Result
- First Time Households (new to your agency)
- Repeat Households (have visited before)
- Total Combined Households (new and have visited before)
- Unique Households
- Speaks English
- Speaks Other
- Nationality/Race Numbers
- Age Group Numbers
This report breaks down and displays stastical outreach data within the date range selected that is then grouped by the demographic chosen. Report settings allow the choice to display a single tracking type or ALL tracking types – USDA Food, Bread and Produce, etc. – whatever your agency is tracking.
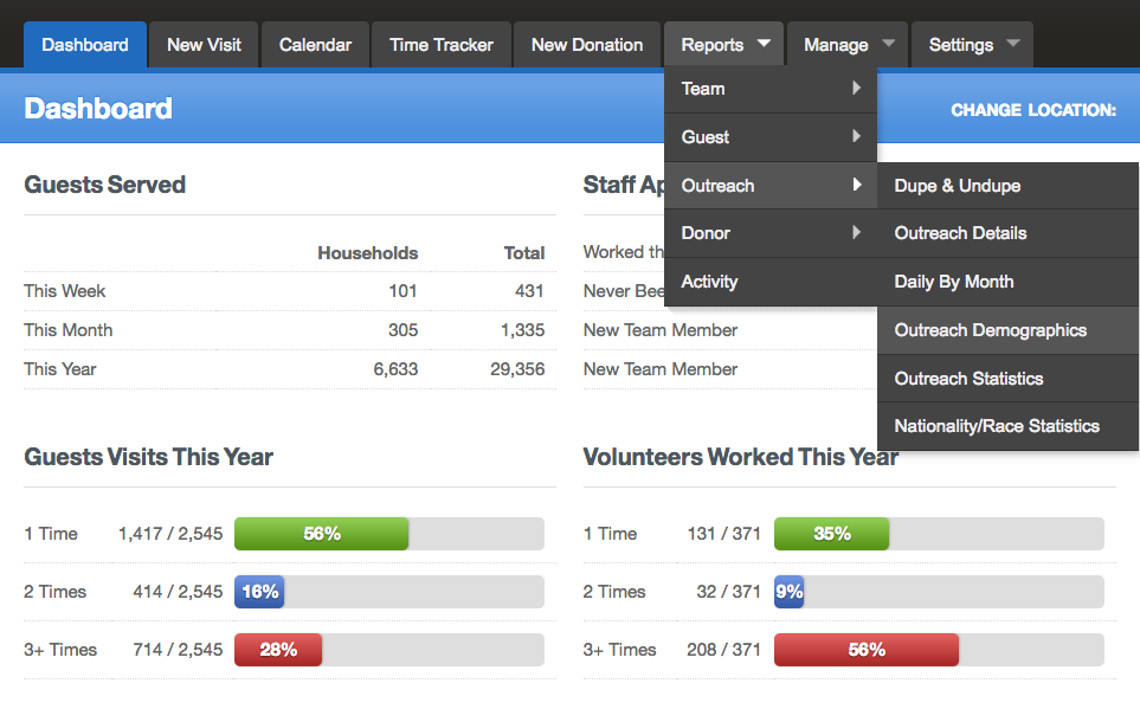
To open this report select the "Reports" tab at the top of the dashboard screen. Drag your curser down to the "Outreach" menu item. This will open a submenu showing the different outreach reports available. Drag your curser to the submenu item “Outreach Demographics” - click it.
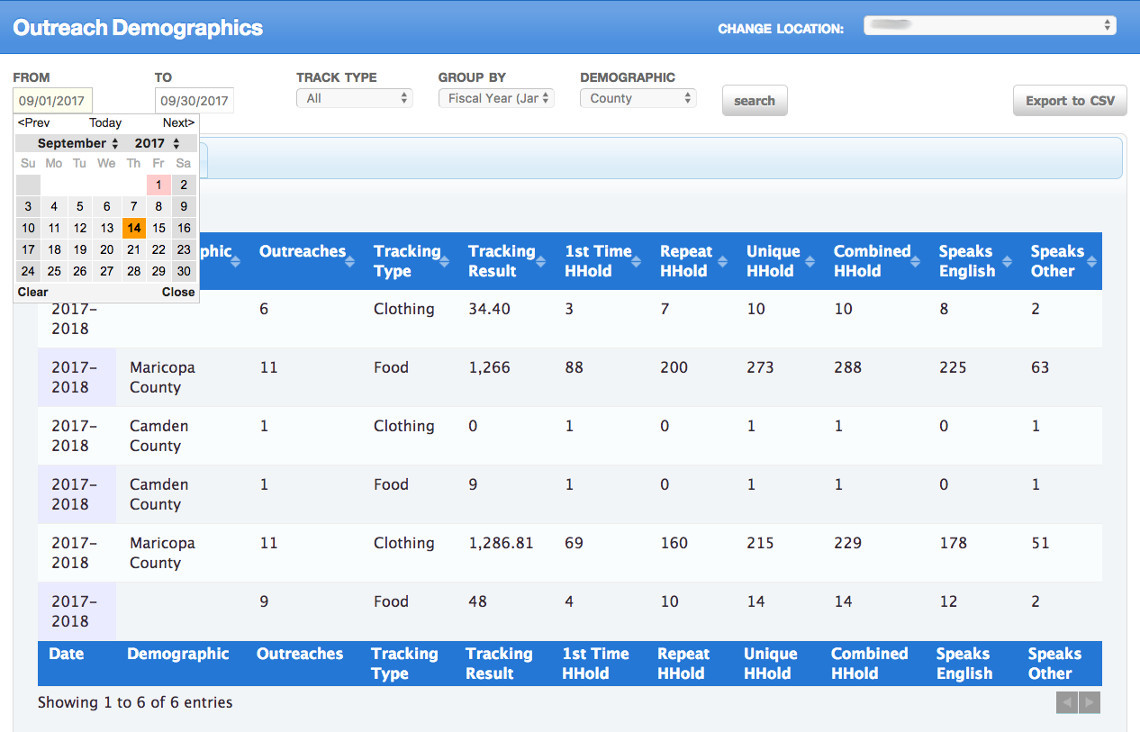
To configure the report, enter in the date ranges the selection of data is to contain. Click in the "From" date box and using the date picker choose the starting date for this report. Follow the same procedure to set the "To" date or the last date your data selection will contain.
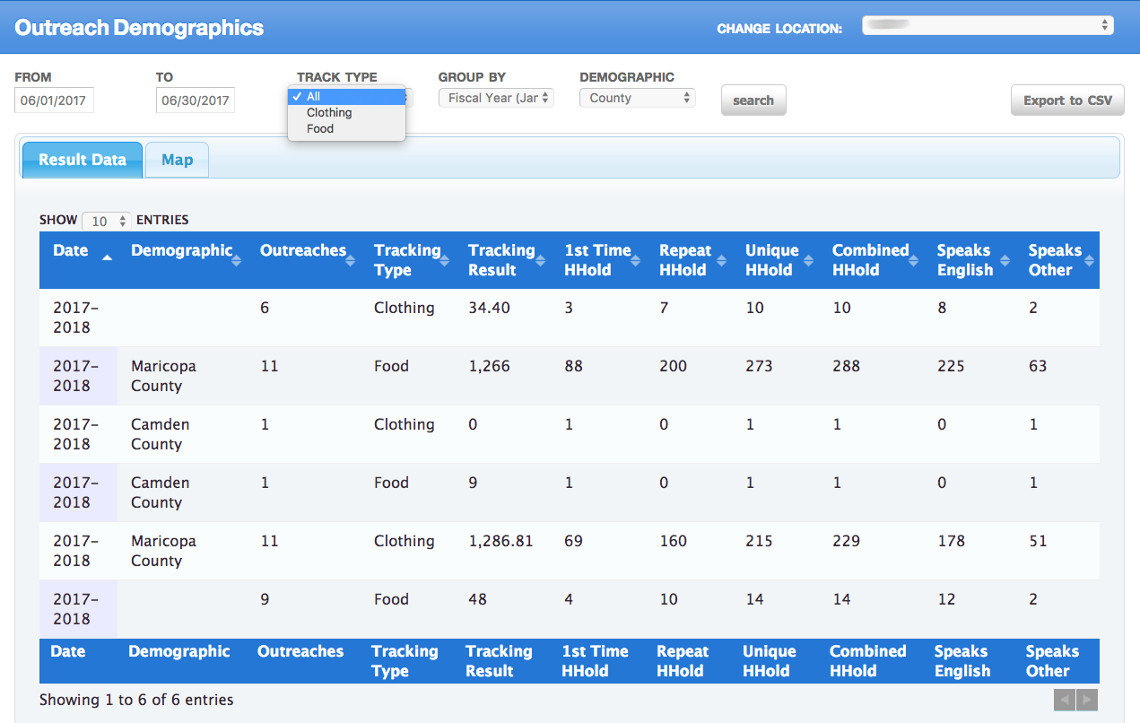
Click on the "Track Type" box to see a list of all of the services that you provide and choose the one to report on.
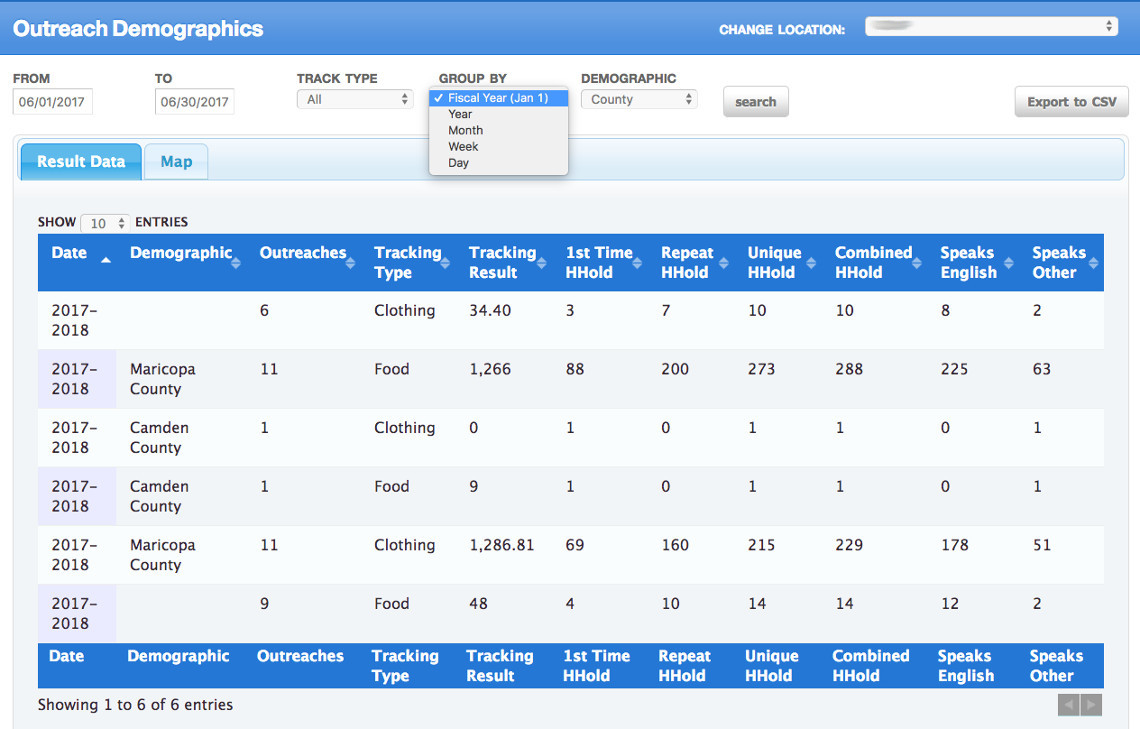
Select how you want your numbers presented by choosing the appropriate "Group By" option. It is important that you understand how "Group By" will affect your report. Each option in the "Group By" select box is to be considered a calendar period. Example; calendar week, month or year etc. The exception is the fiscal option which is based on how the fiscal year is configured.
- Day: This will give you a line item for each day in your date range selected.
- Week: This will give you a line item for each week in your date range selected.
- Month: This will give you a line item for each month in your date range selected.
- Year: This will give you a line item for each year in your date range selected.
- Fiscal Year: This will give you a line item for the fiscal year in your date range selected. This "Group By" also displays the first day of your fiscal setting in brackets (Jan 1).
Select the demographic you want your numbers presented to you by choosing the appropriate "Demographic" option. Choose county, city or zipcode.
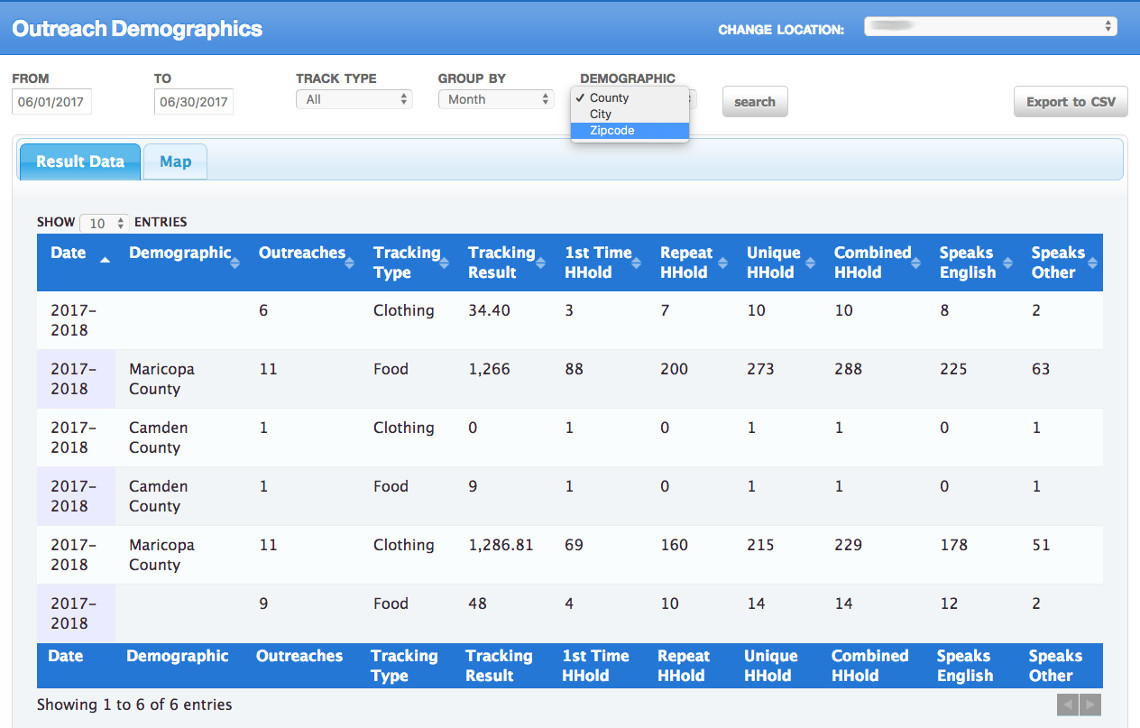
Now that your report is configured for the data requested, click on the "Search" button. This will show the numbers requested on the screen.
Not all of the numbers show on the screen, to see all of the data you will need to export the report and view in Excel. To export the report click on the "Export to CSV" button, found at the top right hand side of the screen. Export the report to have a paper copy or to customize the data to your needs or place in another report format.
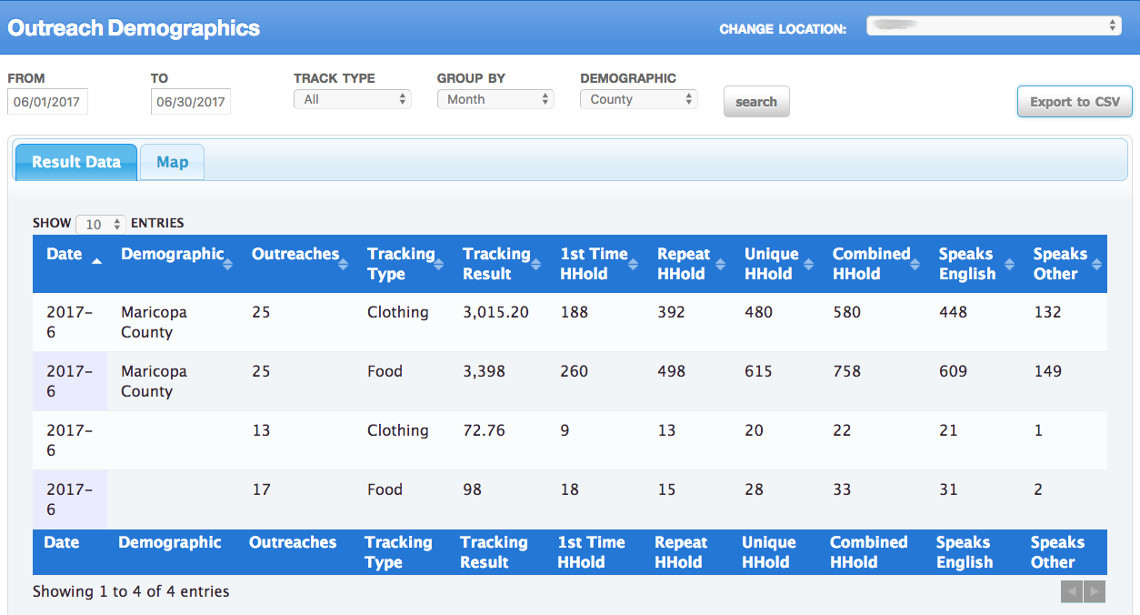
County Report
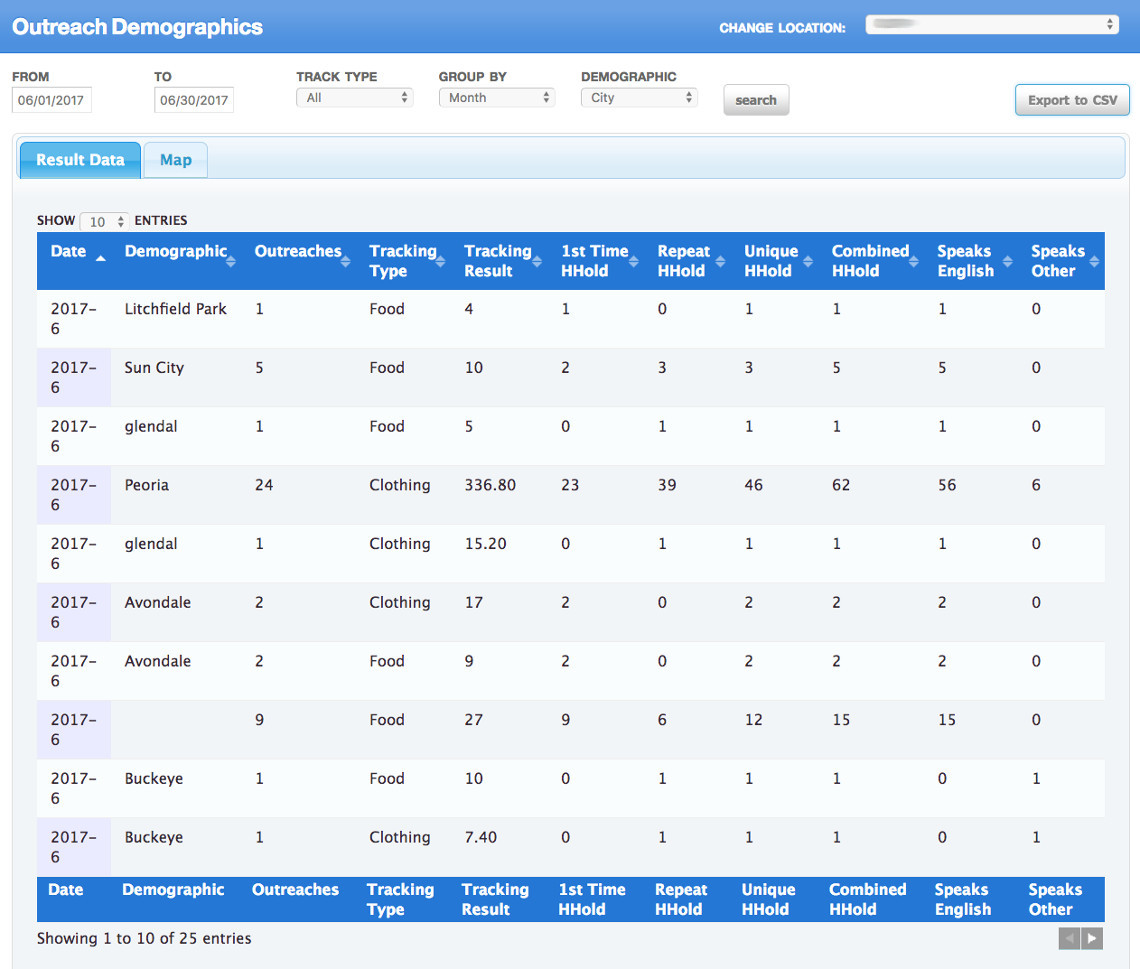
City Report
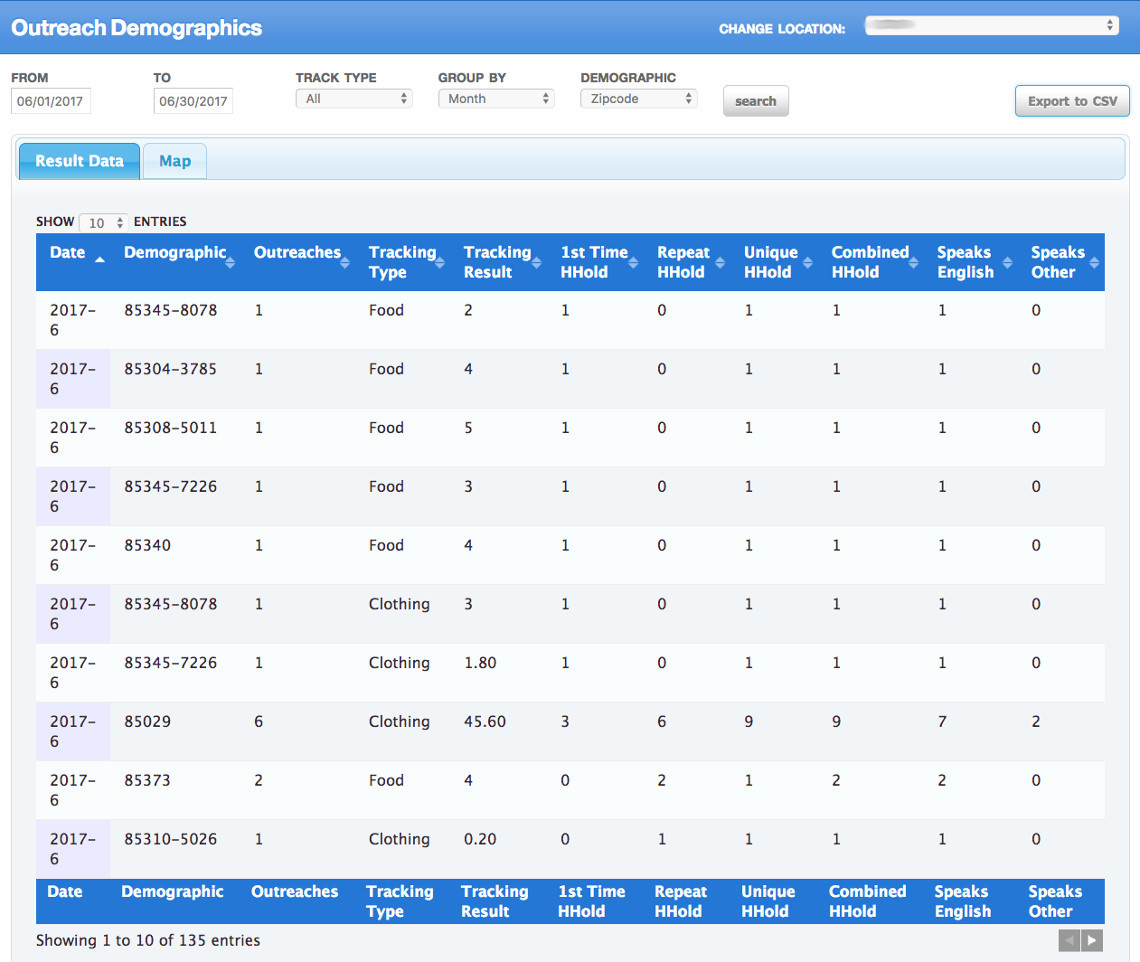
Zipcode Report
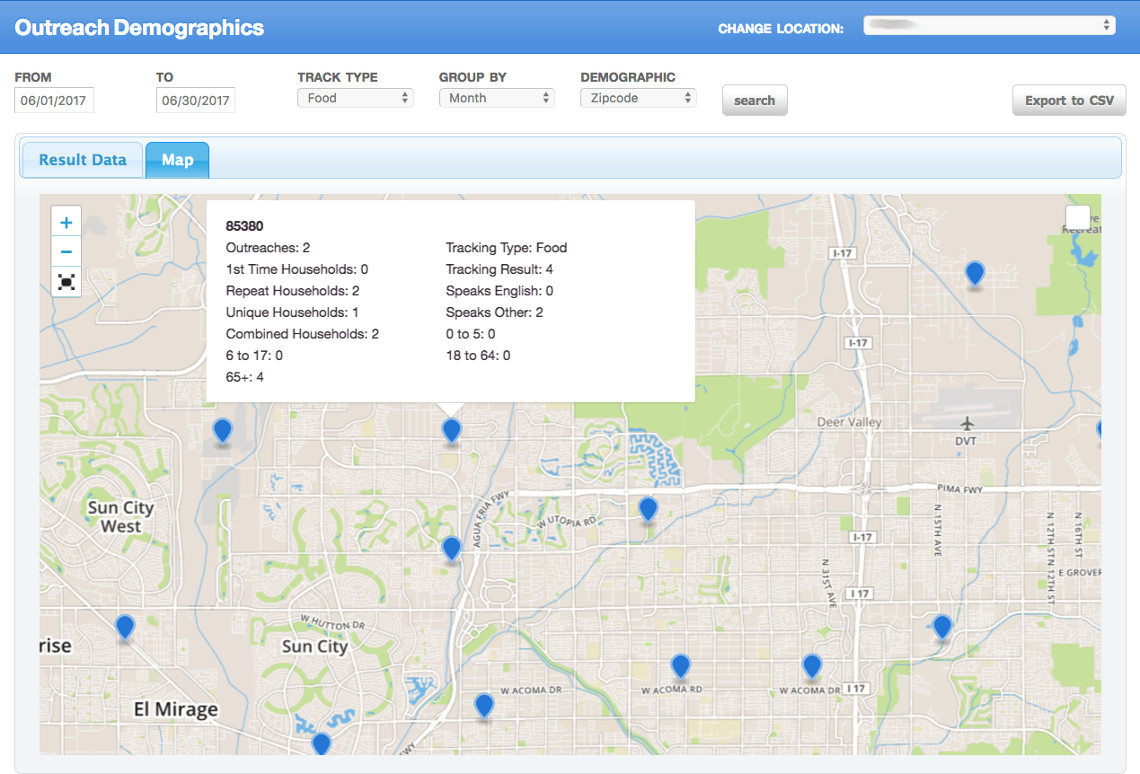
There is also a heat map that gives a visual look at the numbers for the demographics chosen in the report. Click on the "Map" tab to see the map.
Observations
Looking at these reports a couple of things become very apparent. County data is missing, city is mispelled creating extra work to add up all of the different variations of the same city and zipcode is not being entered in consistantly creating the same problem. All of this inconsistant data makes your job more difficult. Here are two solutions that will fix the problem.
- Fix it on the Front End: Have a talk with your volunteers that work on the computers. Show them the difficulty this is causing and train them to slow down and do the data entry accurately. They need to understand the importance of consistant data and how this affects the pantry negatively when data is entered incorrectly.
- Fix it on the Back End: Not my first choice, because it means a lot of work for you when a little talk on the front end can save lots of time.
Understanding the Column Headers
It is important that you understand what the data means after the report is run. This becomes clear when you understand what each column means.
- Date: This column displays the day this outreach occured.
- Demographic: This column displays the county, state or zipcode values.
- Outreaches: This column displays the number of outreaches where someone from that demographic came to get those services.
- Tracking Type: This column displays the goods and services (Help Desired) that was given during the outreach. One line per track type. In this example you see two lines, one for food and one for clothing for each outreach.
- Tracking Result: This column displays the totals calculated for the track type that this line is for. This pantry records "household totals" for food and "weight" for clothing.
- 1st Time HHold: This field shows the number of new households that have come to your pantry during that time period for the first time ever. This is a "Household" number.
- Repeat HHold: This field shows the number of repeat household visits that have come to your pantry during that time period, but have come before as well. This is a "Household" number.
- Inique HHold: This field shows the unique number of household visits that have come to your pantry during that time period. This is a "Household" number.
- Combined HHold: This field shows the total number of household visits that for that time period. It adds the first time and repeat households together. This is a "Household" number.
- The Nationality/Race Columns: What the report presents will depend on how you have setup your nationality/race field. Each of the columns represent one of the nationality/race options in your system. The value is a household number and represents the number of households that identify themselves as being a part of that nationality/race.
- The Age Group Columns: These columns represent the total number of people in the households that visited for that outreach and track type. This is an individual number, if you see 10 then there was 10 individuals that came in that age group.
Examples of How to Make Use of this Report:
Evaluation and Strategic Planning
Example
This report is very valuable in evaluating your service region for your knowledge and strategic planning as well as funding endeavors such as grants and grant reporting.
Your agency serves an entire county area. You pull the Outreach Demographics Report for a Fiscal Year, select “Zipcode” and export to Excel for review and sorting. You realize that 80% of your clients are coming from three zipcodes out of the seven that are showing. Do you need to increase outreach in the remaining zipcode areas? What are the populations in these zipcodes? Are there any other social service agencies in these areas you can partner with to ensure your services are promoted? Think this information through for all categories – County, City, Zipcode – and question/approach from all angles!
Funding Requests and Messaging
Example
You use the same report to compile a grant request to a funder only serving a specific area of your service region. You can easily demonstrate the exact number of households being served in their funding area. TIP: You find that 60% of households come from a specific area. You can look at your Dupe/Undupe Report for total individuals and find what 60% would be for an approximated number.
You meet with the City Council of a City within your service region to inform them of the need in this area and the ways you are addressing it. Search by City and sort in Excel to have perfectly accurate data easily converted to messaging.